Visualising information, i.e. using #Infographics it is more convenient to:
- Understand the overall big picture
- Spot deviations
- Observe trends
- Present and communicate complex information
- Optimise business operations
- Make better decisions
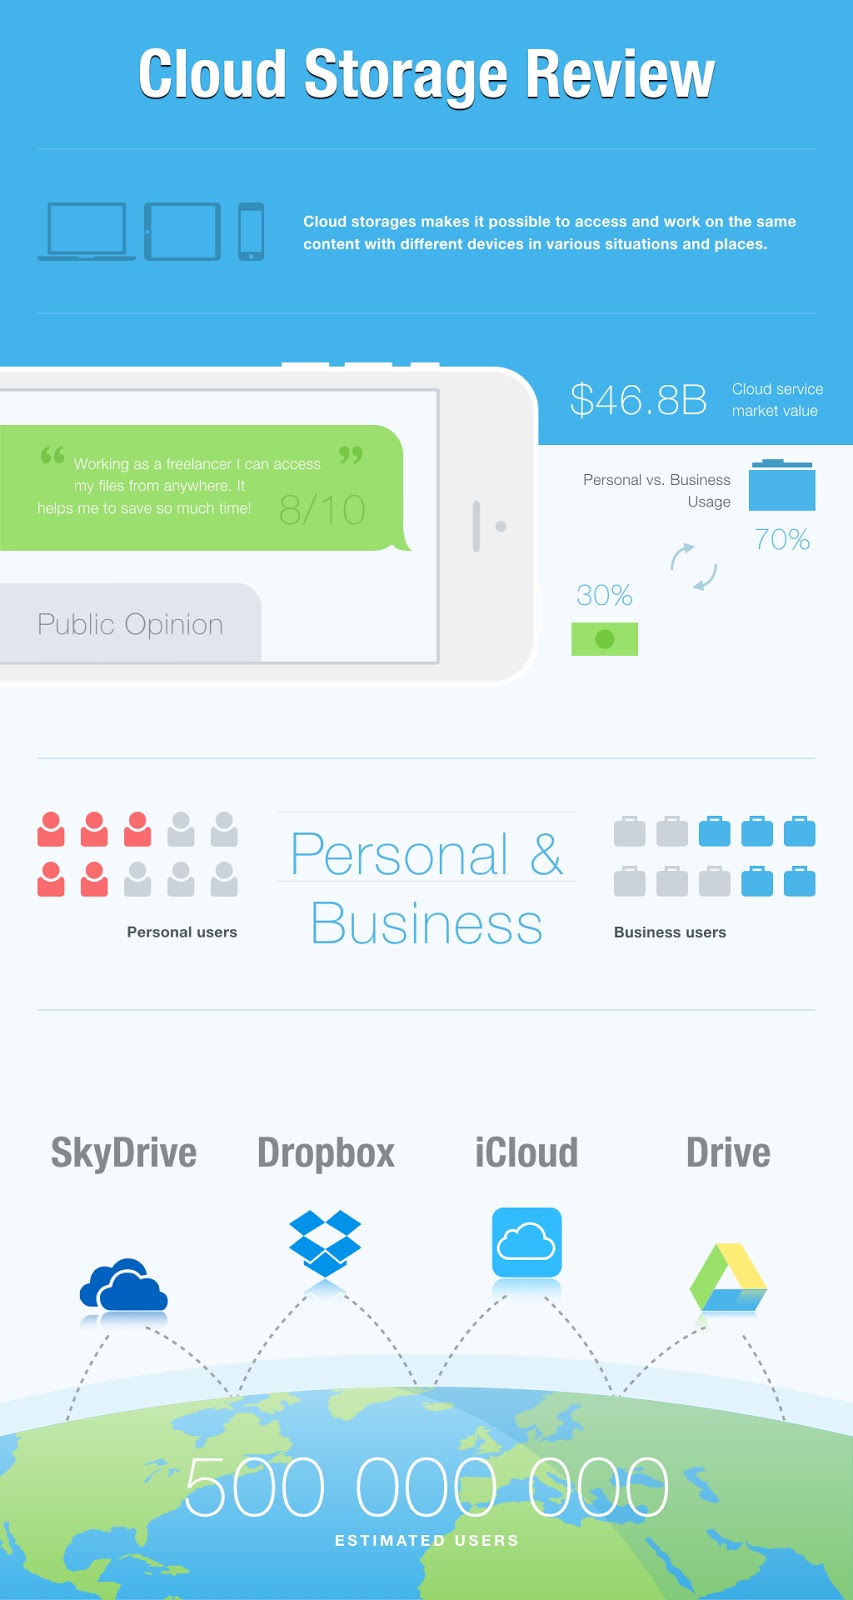 |
| Example: Cloud Storage Review |